
Your booking numbers are in your scheduling tool. Revenue is in your payment processor. Marketing performance is in your email and automation platform. Trying to pull all of this together into a single picture of how your business is actually performing feels like it requires a data analytics degree. Because knowing and optimizing the ins and outs of the business is solely on you.
This is the reality for med spa owners. There isn’t a lack of data, it’s just scattered across five or six disconnected systems with no clear way to make it work together. This results in practice owners like you making decisions based on instinct instead of actual numbers, because building and maintaining a real-time financial dashboard from scratch would be a part-time job on top of everything else you're already managing.
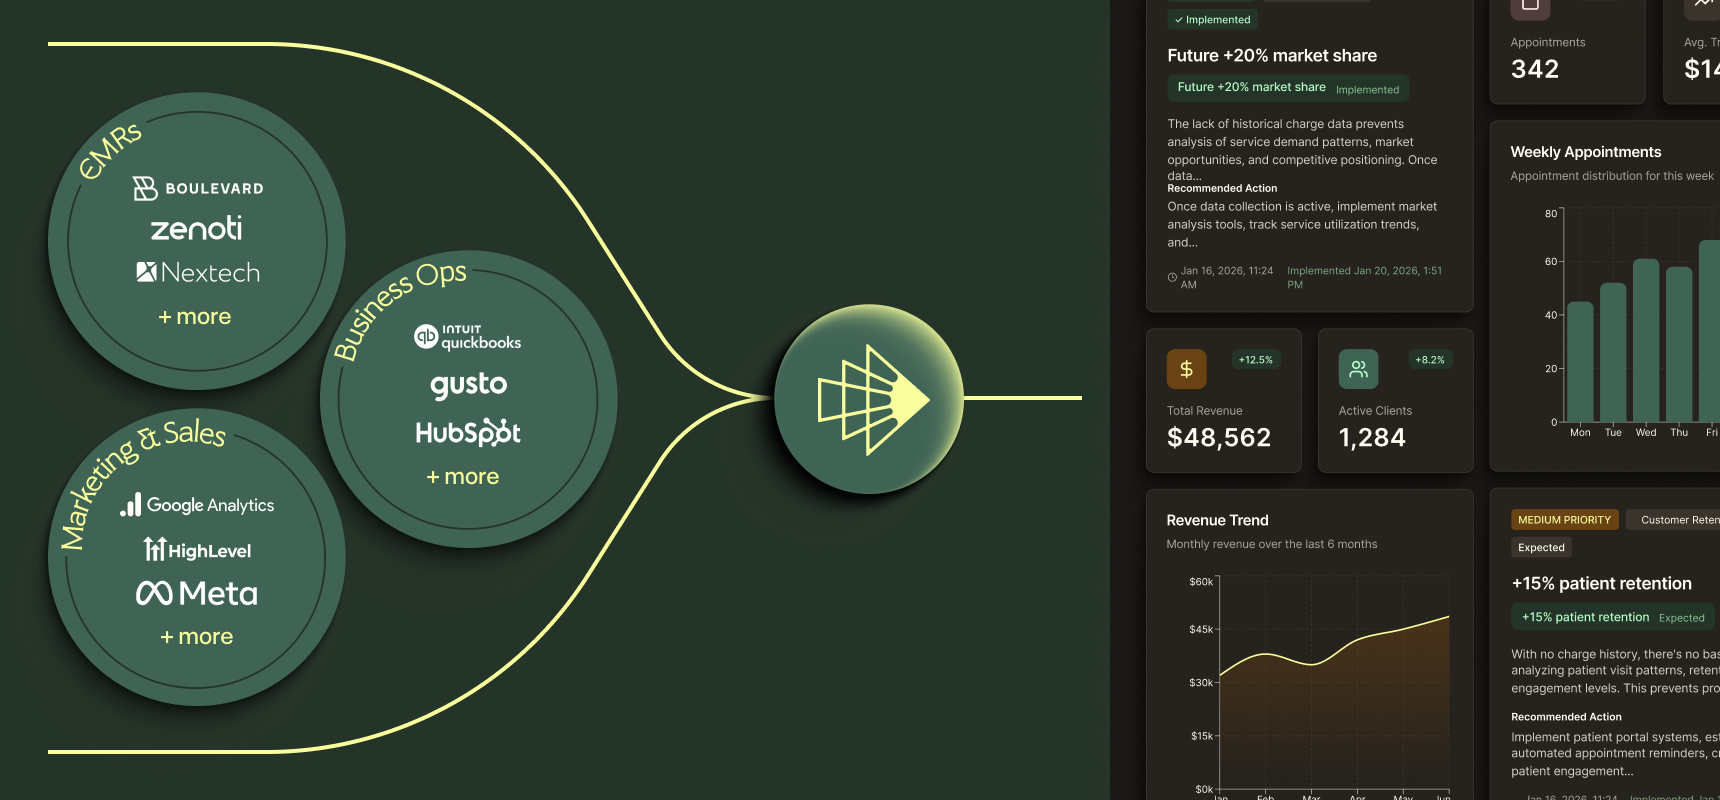
What if there was a shortcut? A way to have all your core systems talk to each other in a single dashboard showing you the metrics that actually matter to drive growth. Here's what that looks like in practice.
The 5 Financial Metrics That Actually Move the Needle
Most practice management platforms will give you dozens of data points. That's the trap. More data doesn't necessarily make better decisions, but the right data does. These are the five metrics worth building a dashboard around, along with the benchmarks that will tell you if you’re on track.
1. Revenue Per Visit (RPV)
Revenue per visit is the most reliable short-term signal of financial health in your practice. It tells you how much revenue, on average, each appointment is actually generating and whether that number is moving in the right direction.
If your RPV is flat or declining while booking volume stays the same, something is off: pricing, service mix, upsell execution, or provider performance. If RPV is climbing, you're extracting more value from every chair hour you have.
Benchmark: Top-performing med spas monitor RPV weekly. The average ticket size at top-performing med spas was $504 in 2024. If yours is consistently below that, there's likely untapped revenue in your current booking volume.
2. Retail Attach Rate
Most practices generate 10–15% of revenue from retail, while top performers reach 25%. You can maximize retail revenue by systematically tracking retail recommendations at the point of care.
Retail attach rate measures what percentage of patient visits include a retail product purchase. It's one of the fastest ways to grow revenue without adding a single new patient because you're deepening the value of relationships you already have.
Benchmark: Med spas actively tracking retail attach rate average 18–22% higher revenue per visit than those that don't. A healthy retail attach rate sits between 25–40%. If yours is below 15%, there's immediate revenue available in your existing traffic.
3. Provider Utilization Rate
How much of your chair time is actually billed? That's provider utilization and it's one of the most expensive blind spots in a growing practice. You're paying for provider hours whether or not those hours are generating revenue.
Every unfilled slot is a fixed cost without a return. When you can see utilization in real time — broken down by provider — you know exactly where to focus scheduling, marketing, and rebooking efforts.
Benchmark: The average provider chair utilization rate in aesthetics practices is 60–70%. Top performers operate at 85%+. A 10% improvement in utilization can add over $70,000 in annual revenue per treatment room. (AmSpa)
4. New vs. Returning Patient Revenue Split
This ratio is your retention health score. If the majority of your revenue is coming from new patients, you're running a leaky bucket and constantly spending to acquire patients you're not keeping.
A healthy split shifts over time toward returning patients because retained patients spend more per visit, refer others, and cost you far less than acquisition. Watching this ratio weekly tells you whether your retention is improving or eroding before it shows up in your financials.
Benchmark: High-performing med spas aim for 70% of revenue from returning patients based on industry leaders' insights. If you're below 50%, patient retention is worth prioritizing immediately.
5. Cancellation & No-Show Rate
Every empty chair is a fixed cost without a return. Cancellations and no-shows are one of the most direct revenue leaks in a med spa and one of the easiest to miss when you're only reviewing numbers monthly.
Tracking cancellation and no-show rate in real time gives your front desk team something to act on immediately: which slots need to be filled, which patients need a rebooking call, and whether this week's recovery efforts are actually working. When that data is visible daily instead of monthly, it goes from a lagging indicator to an operational lever.
Benchmark: Based on average med spa ticket sizes, one no-show per week adds up to roughly $22,000 in lost revenue per year. Most outpatient aesthetic practices see cancellation rates between 10–27%. Top-performing practices keep their rate below 10% through active rebooking and deposit policies. (Zenoti)
How To Build the Dream Dashboard for You
We know you care about making sure your practice is delivering and exceeding the benchmarks we outlined above. We know the issue is that individual tools aren’t built for the speed that your business operates at.
That’s why we built Illume. The reason Illume's dashboard actually gets used is because you don't build it. It builds itself.
Here's how it works: you connect your existing data sources — your practice management software, payment processor, and marketing platforms — to Illume. That data gets cleaned and organized, and lands in a single dashboard for easy viewing. No exports, spreadsheet maintenance, or monthly reconciliation.
Meet Ava — Your Built-In Data Analyst
Illume's most-used feature beyond the dashboard is Ava. Ava is our AI chatbot that lives within every account. She lets owners and their teams talk to their data the way they'd talk to a coworker.
Instead of navigating menus to pull a report, you can ask things like:
- "What's driving the drop in revenue per visit this month?"
- "Which provider has the highest rebook rate over the last 90 days?"
Ava searches your connected data and surfaces the relevant insights immediately.
For practice owners already stretched thin, this changes the math on data-driven management. You don't need to build a report, you just ask a question and get an answer.
Proactive vs. Reactive: The Real ROI of a Financial Dashboard
With Illume, you can move from reactive to proactive management. When your dashboard is current, accessible, and built around decisions, your team members can be self-starters.
Your injectors can see their retention rate is slipping before you tell them. Your front desk manager can see whether her rebooking calls this week are making a dent. You can see which location in your group is underperforming before it affects the quarter.
Discover how team members can only see the metrics relevant to their role with role-based reporting. READ MORE
Businesses with integrated financial dashboards make decisions five times faster than those relying on manual reporting. That speed is a competitive advantage in a market growing at nearly 15% annually. The fastest movers are capturing patient relationships before anyone else does.
See What Your Dashboard Could Look Like
Illume connects to the systems you're already using and builds a financial dashboard around the metrics that actually matter for your practice — without the manual work.
"Illume has become a core tool in my consulting practice. I've rolled it out across my client base because it does something rare: it distills the business down to the KPIs that actually matter, in a format any operator or clinic manager can understand at a glance." — Jessica Hunter, Head of Consulting, Aesthetic Brokers | Hunter Consulting


